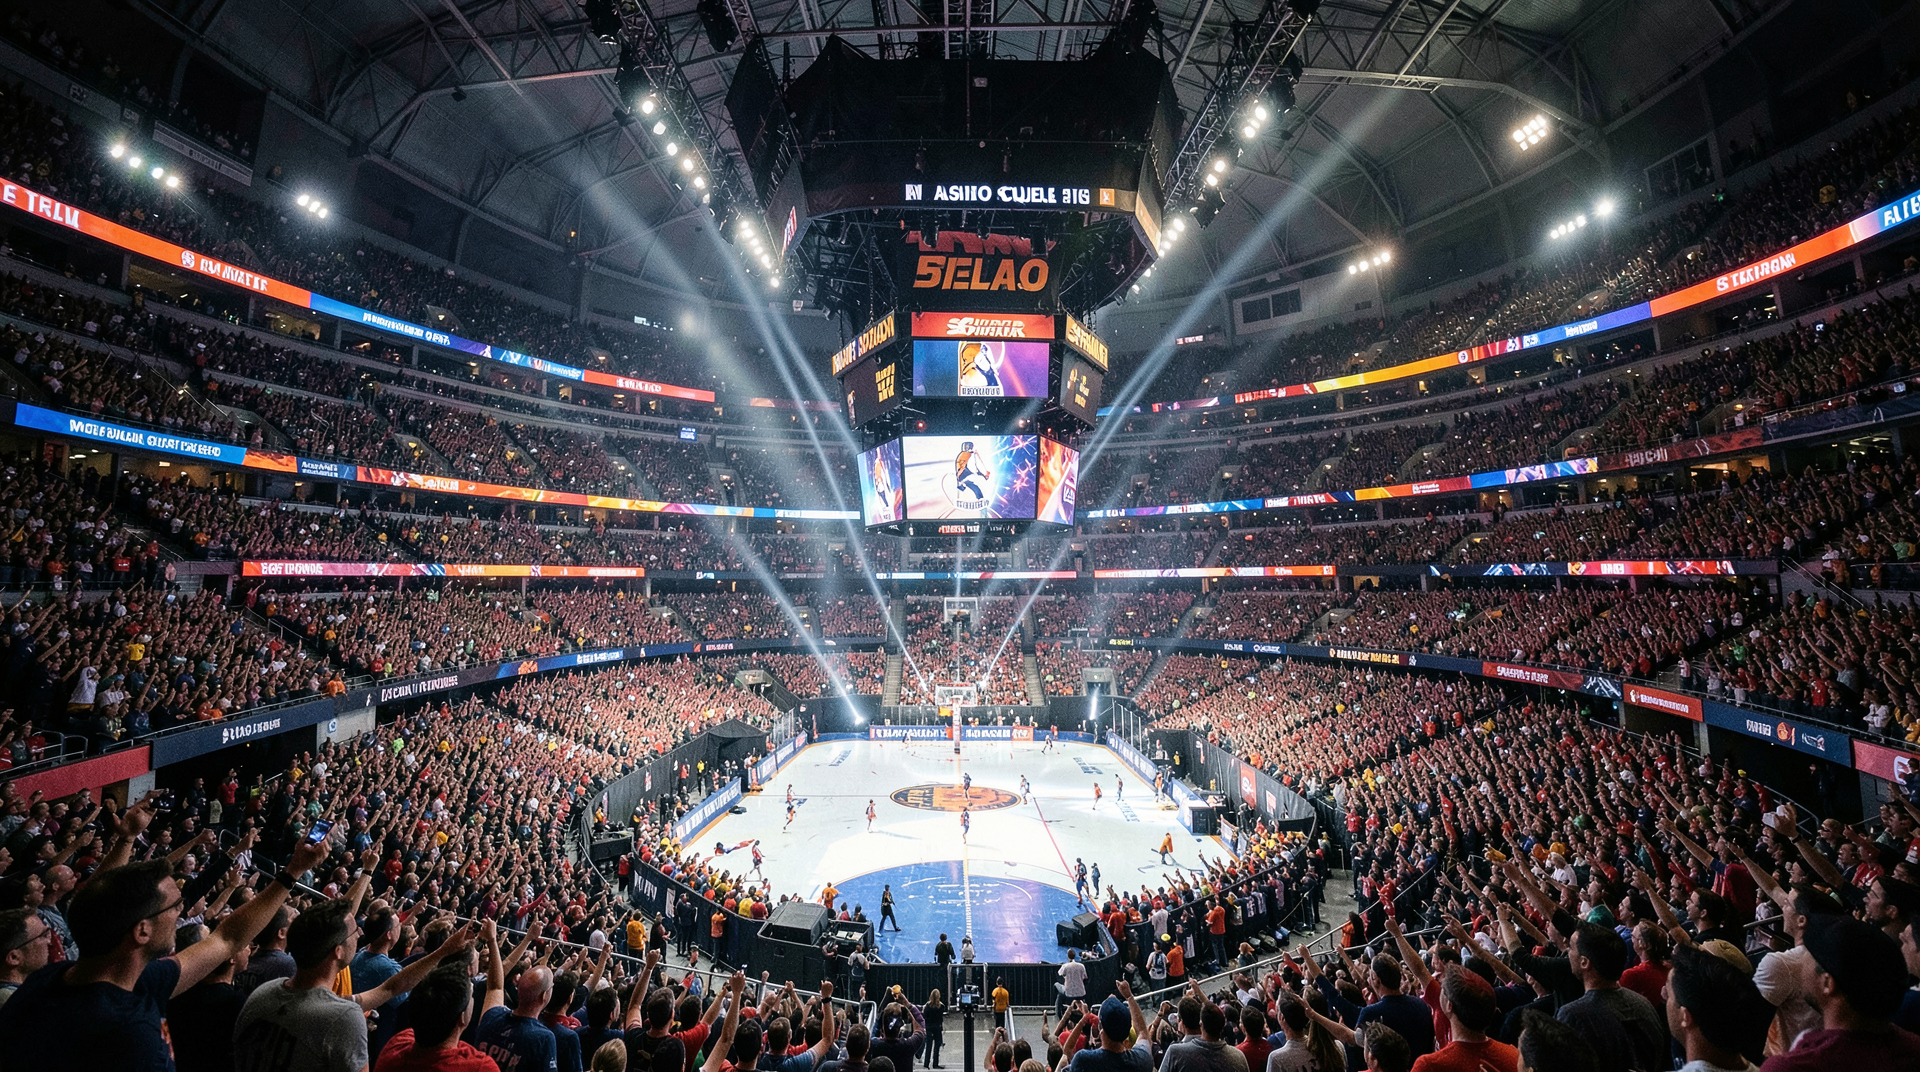
NBA Finals Game 2 sustained the viewership surge that Game 1 ignited. Friday night's Knicks win in San Antonio drew 16.43 million viewers on ABC, peaked at 19.42 million at 11:15 p.m. Eastern, and ran 88 percent ahead of last year's Game 2 — enough to make it ABC's most-watched Game 2 since 2018 and the most-watched program on television that night, in every key demo. [3] The paper's Game 1 account carried the 16.93 million number and the 90 percent year-over-year jump; see that story here. Together the first two games average 16.68 million, up 89 percent and the best two-game Finals start since Cavaliers-Warriors in 2018. [1] [3]
The pattern matters more than either number. A one-game spike can be a curiosity of scheduling or matchup. Two games at this level, following a regular season that closed with the league's biggest audience in 24 years, is a structural reading of the attention market. [3] Live sports is the last thing people watch together, and the Knicks-Spurs pairing is the maximal version of the argument: the largest media market in the country against Wembanyama, the most-watched young star the league has produced in a generation, in a series where Game 2 was decided by one point after a late turnover. [1] Scarcity, stars, suspense — the three inputs no streaming library can manufacture on demand.
MSM framed the games through box scores and coaching adjustments. ESPN led with player stats and tactical breakdowns; the ratings desks at the trade papers did the measurement work. [1] X went elsewhere — highlight dunks, referee complaints, celebrity courtside shots. The divergence is clean: MSM sees a basketball series, X sees a cultural event, and the paper sees a monopoly pricing itself in public.
Rights holders are watching the same tape. Every point of year-over-year growth lands directly in the next rights negotiation and in scatter pricing for whatever inventory remains unsold; ad money follows measured co-viewing, and nothing else on television delivers it at this scale. [2] The surge also reprices the league's non-game inventory — studio shows, highlights, betting integrations — because advertisers buy adjacency to the crowd, not the crowd itself.
The open question is durability through the schedule. The series shifts to New York with the Knicks holding serve on the road, and history says Finals audiences grow when a big-market team plays elimination-adjacent games at home. One game was a curiosity. Two is a pattern. Three would be a thesis, and the thesis has consequences far beyond basketball: every network executive pricing sports rights this summer is quoting these Nielsen tables. [2] [3]
Worth noting for measurement honesty: these figures come from Nielsen's big-data-plus-panel methodology, which has flattered live sports relative to the old panel-only currency. The surge survives any methodology adjustment — 88 percent is not a rounding artifact — but the absolute numbers will be revised, and the league will quote whichever version is higher. The paper quotes both. [3]
-- AMARA OKONKWO, Lagos