NWS Chicago's June 24 event page did the unglamorous work that turns viral weather into usable record: it separated a brief tornado near Huntley — captured on video lofting debris beside a narrow funnel — from several distinct corridors of straight-line wind damage across northern Illinois and northwest Indiana. [1]
The paper's June 23 story on NASA's machine-learning flood warning science asked whether warning systems actually improve life for households. A storm survey is the other half of that question. It documents what happened after the warnings fired, converting an evening of alarming clips into categories a homeowner, insurer, or emergency manager can act on.
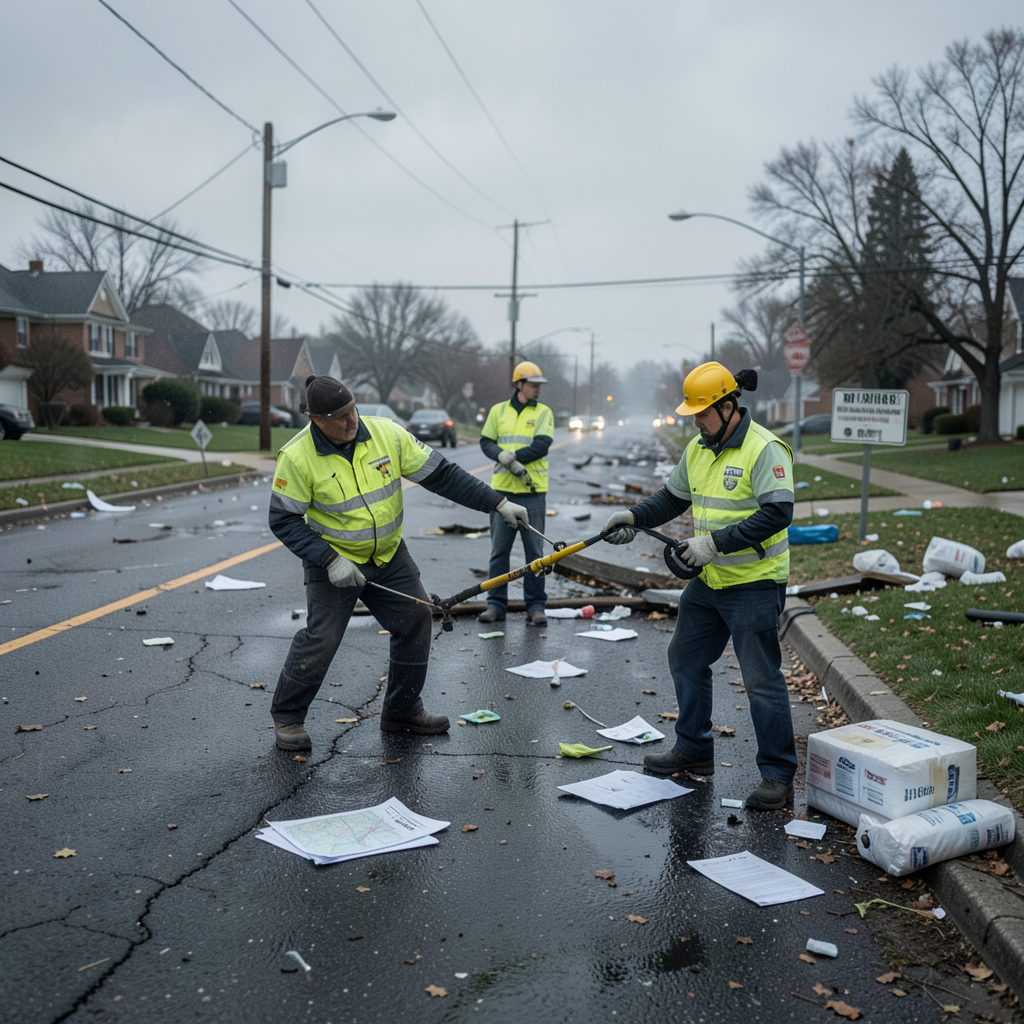
The survey's findings are precise. Scattered storms built through the Wednesday afternoon and persisted into the evening, with concentrated straight-line wind damage near Streamwood, Bartlett, and Hanover Park consistent with gusts of 70 to 75 mph, and a second damaging corridor around Griffith and Merrillville, Indiana, where a survey team rated winds at 75 to 80 mph amid widespread toppled trees. Radar loops from the O'Hare and Midway terminal Doppler radars sampled the velocity signatures in real time. The tornado, by contrast, was brief and localized — one funnel, one video, one track pending final survey. [1]
MSM will run the tornado clip because the tornado clip is legible: rotation, debris, drama, thirty seconds. X will do the same and then argue about whether climate change caused this specific cell. Both instincts miss what the NWS page exists to establish. The evening's most extensive damage was not tornadic at all. Straight-line winds from the apex of a bow echo fan out across much larger areas than any funnel, and they produced the downed limbs, blocked roads, and power interruptions that defined the night for most affected residents. Tornado risk and wind-corridor risk demand different insurance claims, different cleanup decisions, and different respect on the next alert day. A viewer who learned "tornado" from social video would misread both the damage map and the next warning. [1]
There is also a quieter service lesson in how the page works. Local storm reports arrive first, raw and unverified. Survey teams then walk the damage, assign EF-scale ratings where indicators exist, and publish tracks with maps. The hierarchy is explicit: preliminary reports are leads; surveys are findings. In an information environment that treats the first clip as the verdict, a public institution modeling the difference between them is itself infrastructure.
For the households cleaning up Thursday morning, the practical distinctions matter immediately. Wind-corridor damage patterns support tree-loss claims and roof inspections along identifiable corridors. The flood reports embedded in the same event page tell basement owners which creeks overwhelmed storm drains. And the confirmation that only one brief tornado touched down recalibrates the region's sense of luck without minimizing anyone's loss.
The survey workflow itself deserves a sentence of respect. Local storm reports poured in through Wednesday evening as spotters and residents filed observations; none of them was treated as final. Teams then walked corridors, matched debris to wind direction, consulted radar velocity data from two terminal Doppler sites, and published ratings only where damage indicators supported them. Where a tornado touched nothing ratable on the EF scale, it stays unrated rather than guessed at. That restraint is not bureaucratic caution. It is the difference between a rumor with a badge and a measurement with a method — and it is why insurance adjusters, county emergency managers, and municipal public-works departments can build decisions on the finished page without footnoting doubt.
Weather service, at its best, is the conversion of video into categories people can act on. NWS Chicago performed that conversion within hours, in public, with its uncertainty labeled.